
A residential network cannot be judged from a status page or a vendor benchmark. It has to be measured against the destinations you intend to reach, at the hours your schedule will actually run, using the client stack you will actually deploy. Everything else measures somebody else's workload.
This article sets out a repeatable residential proxy performance test: what to fix before starting, which metrics survive a conversation outside engineering, how to classify failures so they point at a fix, and how to avoid the design errors that make a benchmark unreproducible.
Fix the variables before the first request
A proxy benchmark is only meaningful if the only thing changing between runs is the provider. That means deciding the target list, the concurrency, the rotation policy, the timeout, the retry rule and the evaluation window in advance, writing them down, and refusing to adjust any of them once measurement begins.
The temptation to tune mid-run is strong, because an early poor result looks like a configuration problem. Resist it. Tuning during a comparison converts the exercise into a story about which provider was tested after you got better at the tooling, which is not a finding anyone can act on.
Measure the things a business will ask about
Latency percentiles are useful to engineers and almost useless to anyone approving spend. The metrics that travel are the ones expressed in outcomes: what a usable record costs, how often the pipeline stalls, and how quickly somebody answers when it does.
| Metric | Definition | Why it matters |
|---|---|---|
| Useful response rate | Responses containing the data you needed | Status codes overstate success |
| Cost per usable record | Spend divided by records kept | The only figure that leaves the team |
| Attempts per record | Requests issued per stored result | Exposes retry amplification |
| Location hit rate | Exits landing in the requested region | Decides whether the data is valid |
| Support response time | Ticket raised to answer that helped | Predicts the cost of a bad week |
Record each of these per destination rather than as a single blended figure. Residential performance varies enormously by target, and an average across a mixed list hides both the destinations that work perfectly and the one that is about to become a problem.
Classify failures instead of counting them
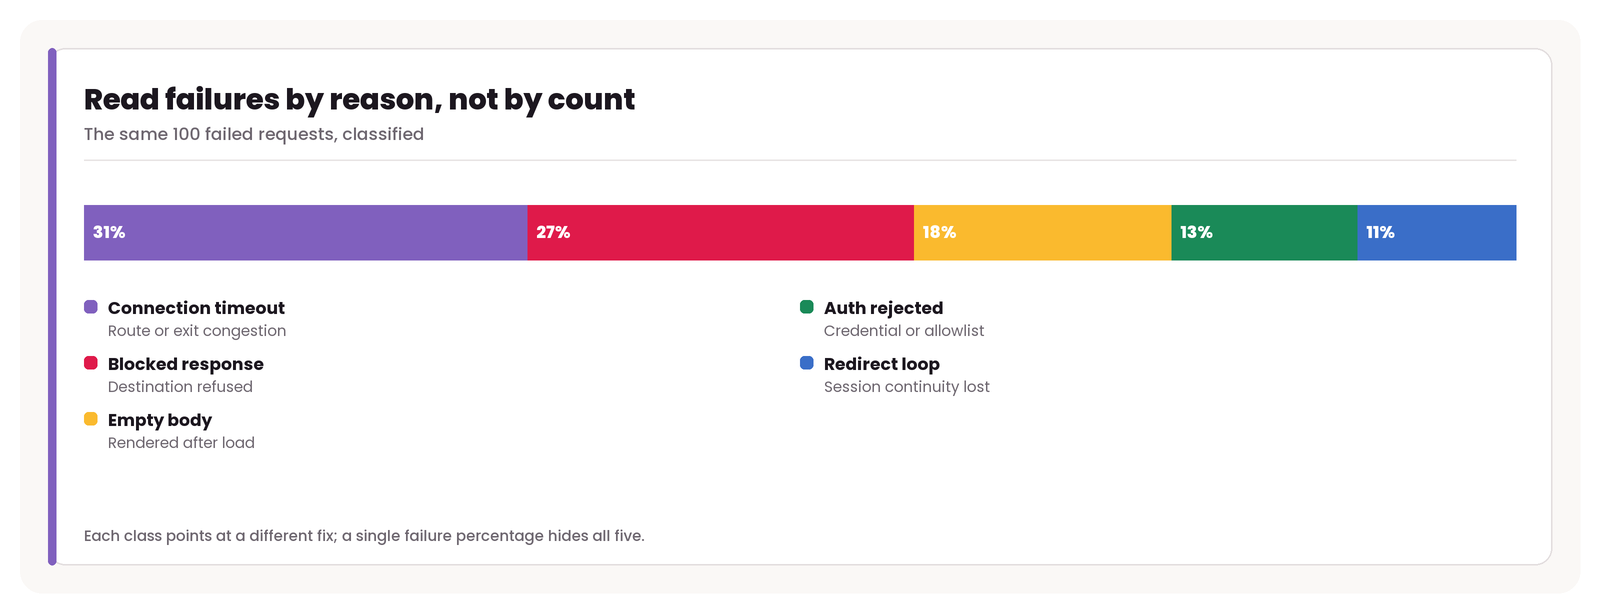
A single failure percentage is the least actionable number in a proxy report. Five per cent failures caused by connection timeouts calls for a different response than five per cent caused by blocked responses, and both differ from five per cent caused by an expired session sending the collector to a sign-in page.
- Connection timeout — the exit or the route is congested; lower concurrency first
- Refused or challenged — the destination differentiated; review rate and route
- Empty or partial body — content rendered after load; the client stack is the problem
- Authentication rejected — credential or allowlist drift, not a network fault
- Redirect loop — session continuity was lost mid-journey
Tagging every failure at the point it occurs costs a few lines of code and turns a benchmark from a score into a diagnosis.
Run the test twice, in different windows
Residential capacity follows the people supplying it. A pool that performs beautifully at midnight in its own timezone can behave differently at midday when the same households are using their connections. A single run therefore measures a moment, not a network.
Two windows separated by at least eight hours is usually enough to expose the pattern. Where the two runs disagree materially, that variance is itself the finding, and it should be reported rather than averaged away — a workload with a fixed nightly schedule cares only about the window it will run in.
Design errors that ruin a benchmark
Testing against a site you do not intend to use
Generic echo endpoints and speed-test services tell you about the route to those services. They say nothing about how your actual destinations respond, which is the only question the test exists to answer.
Letting the trial plan differ from the real plan
Trial tiers frequently cap concurrency, restrict targeting depth, or exclude regions. A result obtained on a restricted tier does not transfer to the plan you would buy, so confirm which limits applied before recording anything.
Ignoring the client stack
Connection pooling, DNS resolution and TLS negotiation all sit between your code and the gateway, and all can dominate the numbers. Benchmark with the library and settings the production job will use, not with a minimal script written for the test.
Size the sample so the result means something
Benchmarks are routinely run on too few requests to distinguish a real difference from ordinary variance. Twenty requests against a destination that fails one time in ten will show a hundred per cent success rate roughly one attempt in eight, which is enough to pick the wrong provider with complete confidence.
A practical floor is a few hundred requests per destination per provider, spread across the evaluation window rather than fired in a burst. Where budget forces a smaller sample, narrow the target list instead of thinning the per-target count: a confident answer about three destinations is worth more than an unreliable one about twenty.
Turn the measurement into a decision
A benchmark that ends in a table of numbers usually ends in an argument. Decide the decision rule before the data arrives: which metric leads, what margin counts as a real difference, and what disqualifies a provider outright regardless of its scores. Writing that down in advance removes the temptation to reweight the criteria once a preferred vendor comes second.
A workable rule for most teams reads something like this: disqualify anything below the required location hit rate, rank the survivors on cost per usable record, and break ties on support response. Three sentences, agreed beforehand, will resolve the conclusion faster than any additional measurement.
Report the result so it can be re-run
A performance conclusion has a shelf life measured in weeks. Pools change, destinations change, and the plan you tested may not be the plan you renew onto. Store the target list, the configuration, the raw per-destination results and the dates alongside the summary, so the next review is a re-run rather than a redesign.
Keep the test volume proportionate as well. A benchmark that places more load on a destination than the production workload ever would is not a realistic measurement, and it imposes a cost on somebody who never agreed to fund your evaluation.
Re-test at renewal, not only at purchase
The provider you benchmarked is not necessarily the provider you are renewing with. Pools are restructured, regional supply shifts, plans get repackaged, and the destinations themselves change how they respond. A short re-run against the original target list, using the stored configuration, converts the renewal from a habit into a decision and occasionally reveals that a cheaper option has caught up.
Keeping the harness runnable is what makes that practical. A benchmark that takes a day to rebuild will not be repeated; one that takes twenty minutes to launch will be.
Measurement, condensed
- Freeze the target list before testing
- Run every provider on one script
- Classify failures by reason
- Repeat across two time windows
- Report cost per successful record